Measurement Error and Factor Analysis
Measurement error
Suppose we want to measure reasoning ability. For participant \(i\), the true reasoning ability score is \(T_{i}\) and the observed score is \(y_{i}\). If there is no measurement error, we would expect that
\[y_{i}=T_{i}.\]
However, often times, we can not perfectly measure something like reasoning ability because of measurement error. With measurement error, the above equation becomes
\[y_{i}=T_{i}+e_{i}.\]
where \(e_{i}\) is the difference between the observed value and its true score in reasoning ability for participant \(i\). Measurement error is almost always present in a measurement. It is caused by unpredictable fluctuations in the the data collection. It can show up as different results for the same repeated measurement.
It is often assumed that the mean of \(e_{i}\) is equal to 0. We need to estimate the variance of \(e_{i}\). Note that we ignore the systematic errors here. The measurement error discussed here is purely random error.
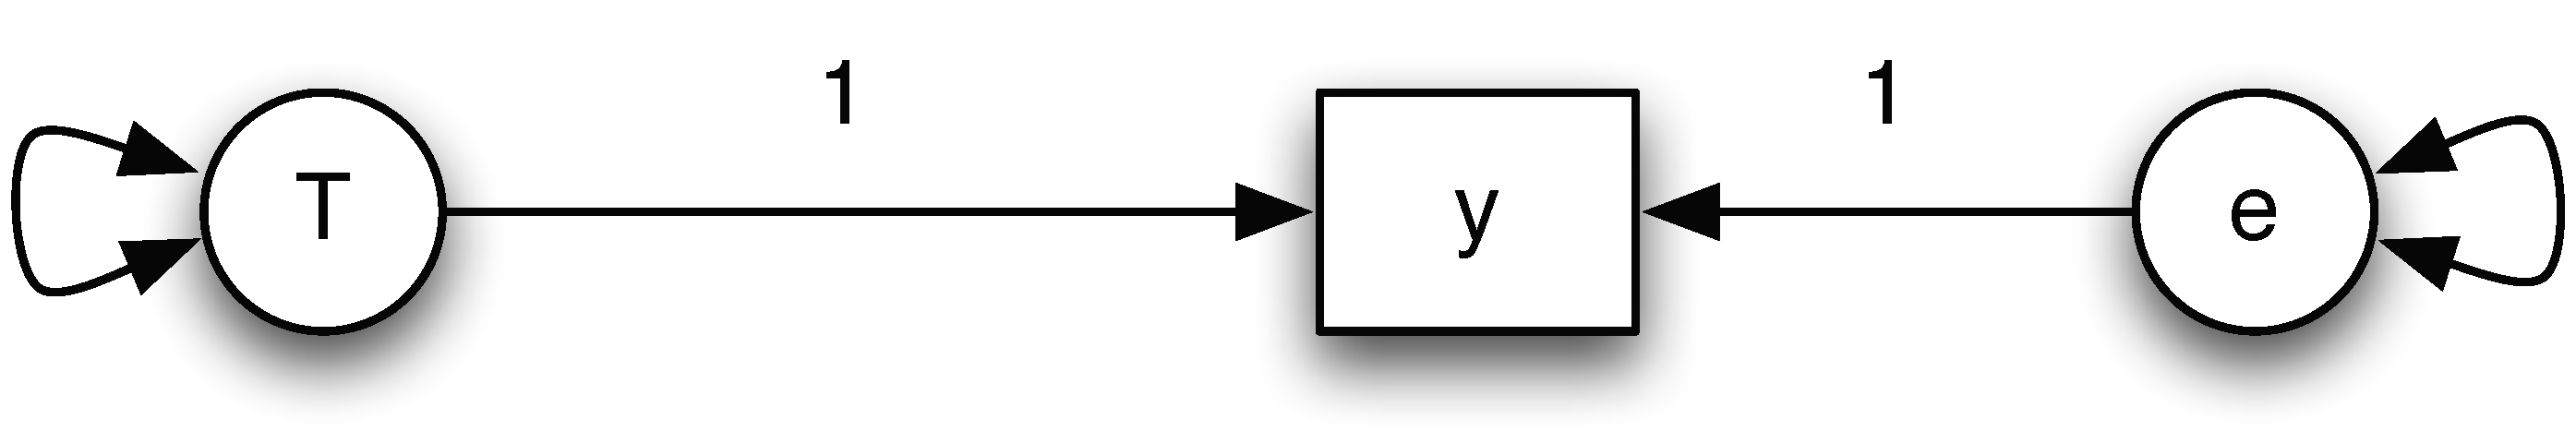
We can express the measurement error using a path diagram shown below. Both the true score and the measurement error are unobserved. The only quantity that is available is the observed score \(y\). From the relationship, we can easily see that
\[ Var(y)=Var(T) + Var(e). \]
That is the observed variance is equal to the sum of the true score variance and the measurement error variance. Note that reliability is define as
\[ reliability = \frac{Var(T)}{Var(T) + Var(e)}.\]
Measurement error can be estimated by comparing multiple measurements, and reduced by averaging multiple measurements.
Influences of measurement error
The most well known influence of measurement error is the attenuation of a relationship. For example, it can lead to reduced correlation between two variables if the two variables are observed with measurement error. In terms of regression analysis, it results in attenuated regression slope estimates, which is also known as regression dilution.
We can illustrate this through an example on correlation. The path diagram for the example is given below.
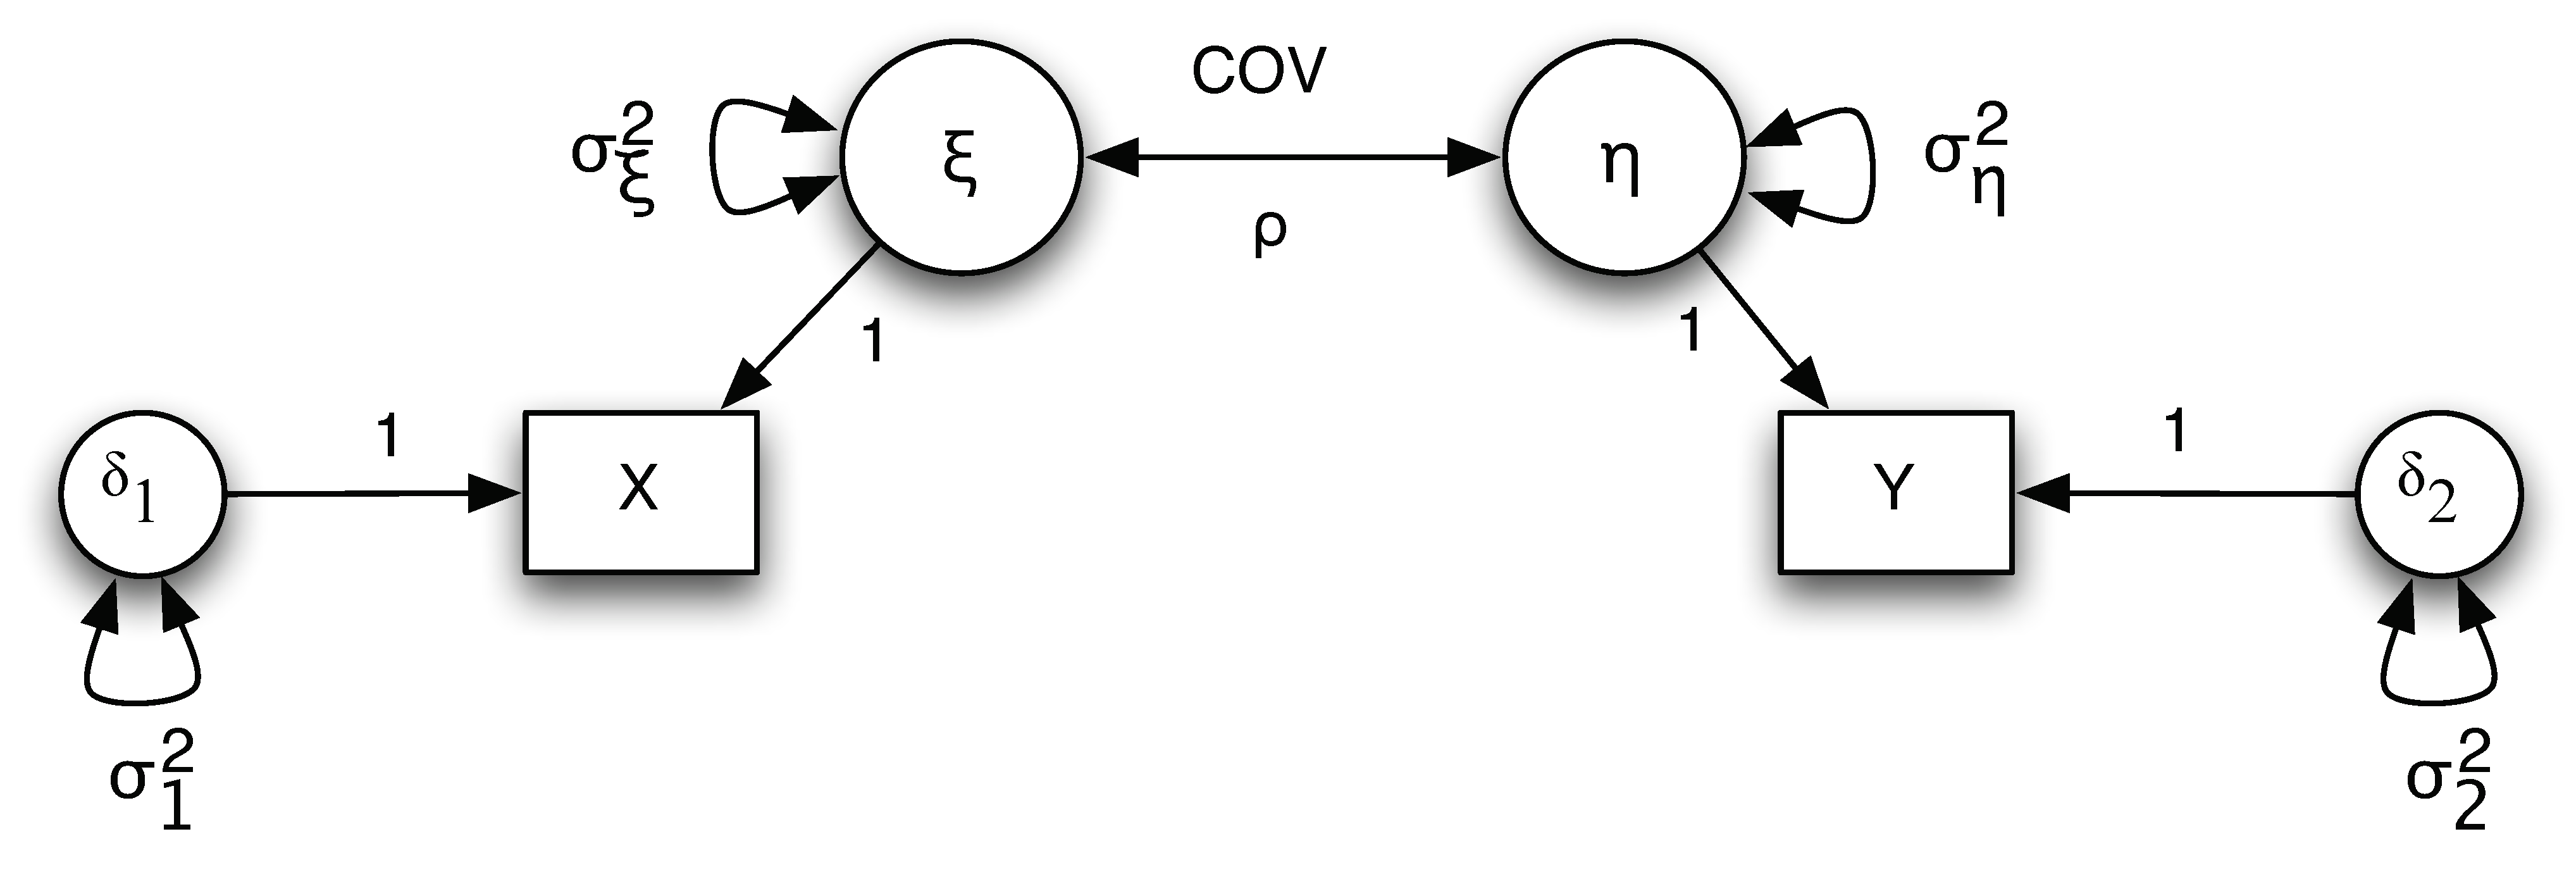
Note that from the diagram, we have
\[ X = \xi + \delta_1 \text{ and } Y = \eta + \delta_2.\]
The variances for the true score $\xi$ and $\eta$ are $\sigma_{\xi}^2$ and $\sigma_{\eta}^2$, respectively. The variances for the measurement error $\delta_1$ and $\delta_2$ are $\sigma_{1}^2$ and $\sigma_{2}^2$, respectively. The covariance between $\xi$ and $\eta$ is $\sigma_{\xi \eta}$
The correlation between the true scores is
\[ \rho_{\xi\eta}=\frac{COV(\xi,\eta)}{\sigma_{\xi}\sigma_{\eta}}=\frac{\sigma_{\xi\eta}}{\sigma_{\xi}\sigma_{\eta}}\]
and the correlation between the observed scores is
\[\rho_{XY}=\frac{COV(X,Y)}{\sqrt{VAR(X)VAR(Y)}}=\frac{\sigma_{\xi\eta}}{\sqrt{(\sigma_{\xi}^{2}+\sigma_{1}^{2})(\sigma_{\eta}^{2}+\sigma_{2}^{2})}}.\]
Clearly, \( \rho_{xy} < \rho_{\xi \eta} \).
How to deal with measurement error?
If we know the variance of measurement errors, we can correct the influences by including measurement errors in a model. With only a single indicator for the latent variable \(T\) (the true score variable), we cannot estimate the variance of measurement errors. For example, for the measurement error model, we have one pieces of information – the variance of \(y\). However, we need to estimate the variance of \(T\) and the variance of \(e\). Thus, we are short of information. If we have multiple indicators of \(T\), we can estimate the measurement error variance and the variance of \(T\). This leads to factor models.
Factor analysis
Factor analysis is a statistical method for studying the dimensionality of a set of variables/indicators. Factor analysis examines how underlying constructs influence the responses on a number of measured variables/indicators. It can effectively handle/model measurement errors. There are basically two types of factor analysis: Exploratory Factor Analysis (EFA) and Confirmatory Factor Analysis (CFA).
- Exploratory factor analysis (EFA) attempts to discover the nature of the constructs influencing a set of responses. It can be used to explore the dimensionality of a measurement instrument by finding the smallest number of interpretable factors needed to explain the correlations among a set of variables.
- Confirmatory factor analysis (CFA) tests whether a specified set of constructs is influencing responses in a predicted way. It can be used to study how well a hypothesized factor model fits a new sample from the same population or a sample from a different population.
A typical factor analysis model expresses a set of observed variables \(y_{j}(j=1,\ldots,p)\) as a function of factors \(f_{k}(k=1,\ldots,m)\) and residuals/measurement errors/unique factors \(e_{j}(j=1,\ldots,p)\). Specifically, we have
\begin{eqnarray*} y_{i1} & = & \lambda_{11}f_{i1}+\lambda_{12}f_{i2}+\ldots+\lambda_{1m}f_{m1}+e_{i1}\\& \ldots\\ y_{ij} & = & \lambda_{j1}f_{i1}+\lambda_{j2}f_{i2}+\ldots+\lambda_{jm}f_{ij}+e_{ij}\\ & \ldots\\ y_{ip} & = & \lambda_{p1}f_{i1}+\lambda_{p2}f_{i2}+\ldots+\lambda_{pm}f_{im}+e_{im} \end{eqnarray*}
where $\lambda_{jk}$ is a factor loading (regression coefficient of $f_{k}$ on $y_{j}$) and $f_{ik}$ is the factor score for Person $i$ on the $k$th factor.
In a factor model, each observed variable (indicator \(y_{1}\) through indicator \(y_{p}\)) is influenced by both the underlying common factors \(f\) (factor 1 through factor \(m\)), and the underlying unique factors \(e\) (error 1 through error \(p\)). The strength of the link between each factor and each indicator, measured by the factor loading, varies, such that a given factor influences some indicators more than others. Factor analyses can be performed by examining the pattern of correlations (or covariances) among the observed variables. Measures that are highly correlated (either positively or negatively) are likely influenced by the same factors, while those that are relatively uncorrelated are likely influenced by different factors.
To cite the book, use:
Zhang, Z. & Wang, L. (2017-2026). Advanced statistics using R. Granger, IN: ISDSA Press. https://doi.org/10.35566/advstats. ISBN: 978-1-946728-01-2.
To take the full advantage of the book such as running analysis within your web browser, please subscribe.