
Structural Equation Models
Simply speaking, a structural equation model (SEM) is a combination of confirmatory factor analysis and path analysis. Structural equation modeling includes two sets of models – the measurement model and the structural model. The measurement model can be expressed as a factor model. Figure 1 is a model to measure cognitive ability using three variables – verbal ability, math ability, and speed ability (note each of them can be viewed as factors measured by lower level observed variables).
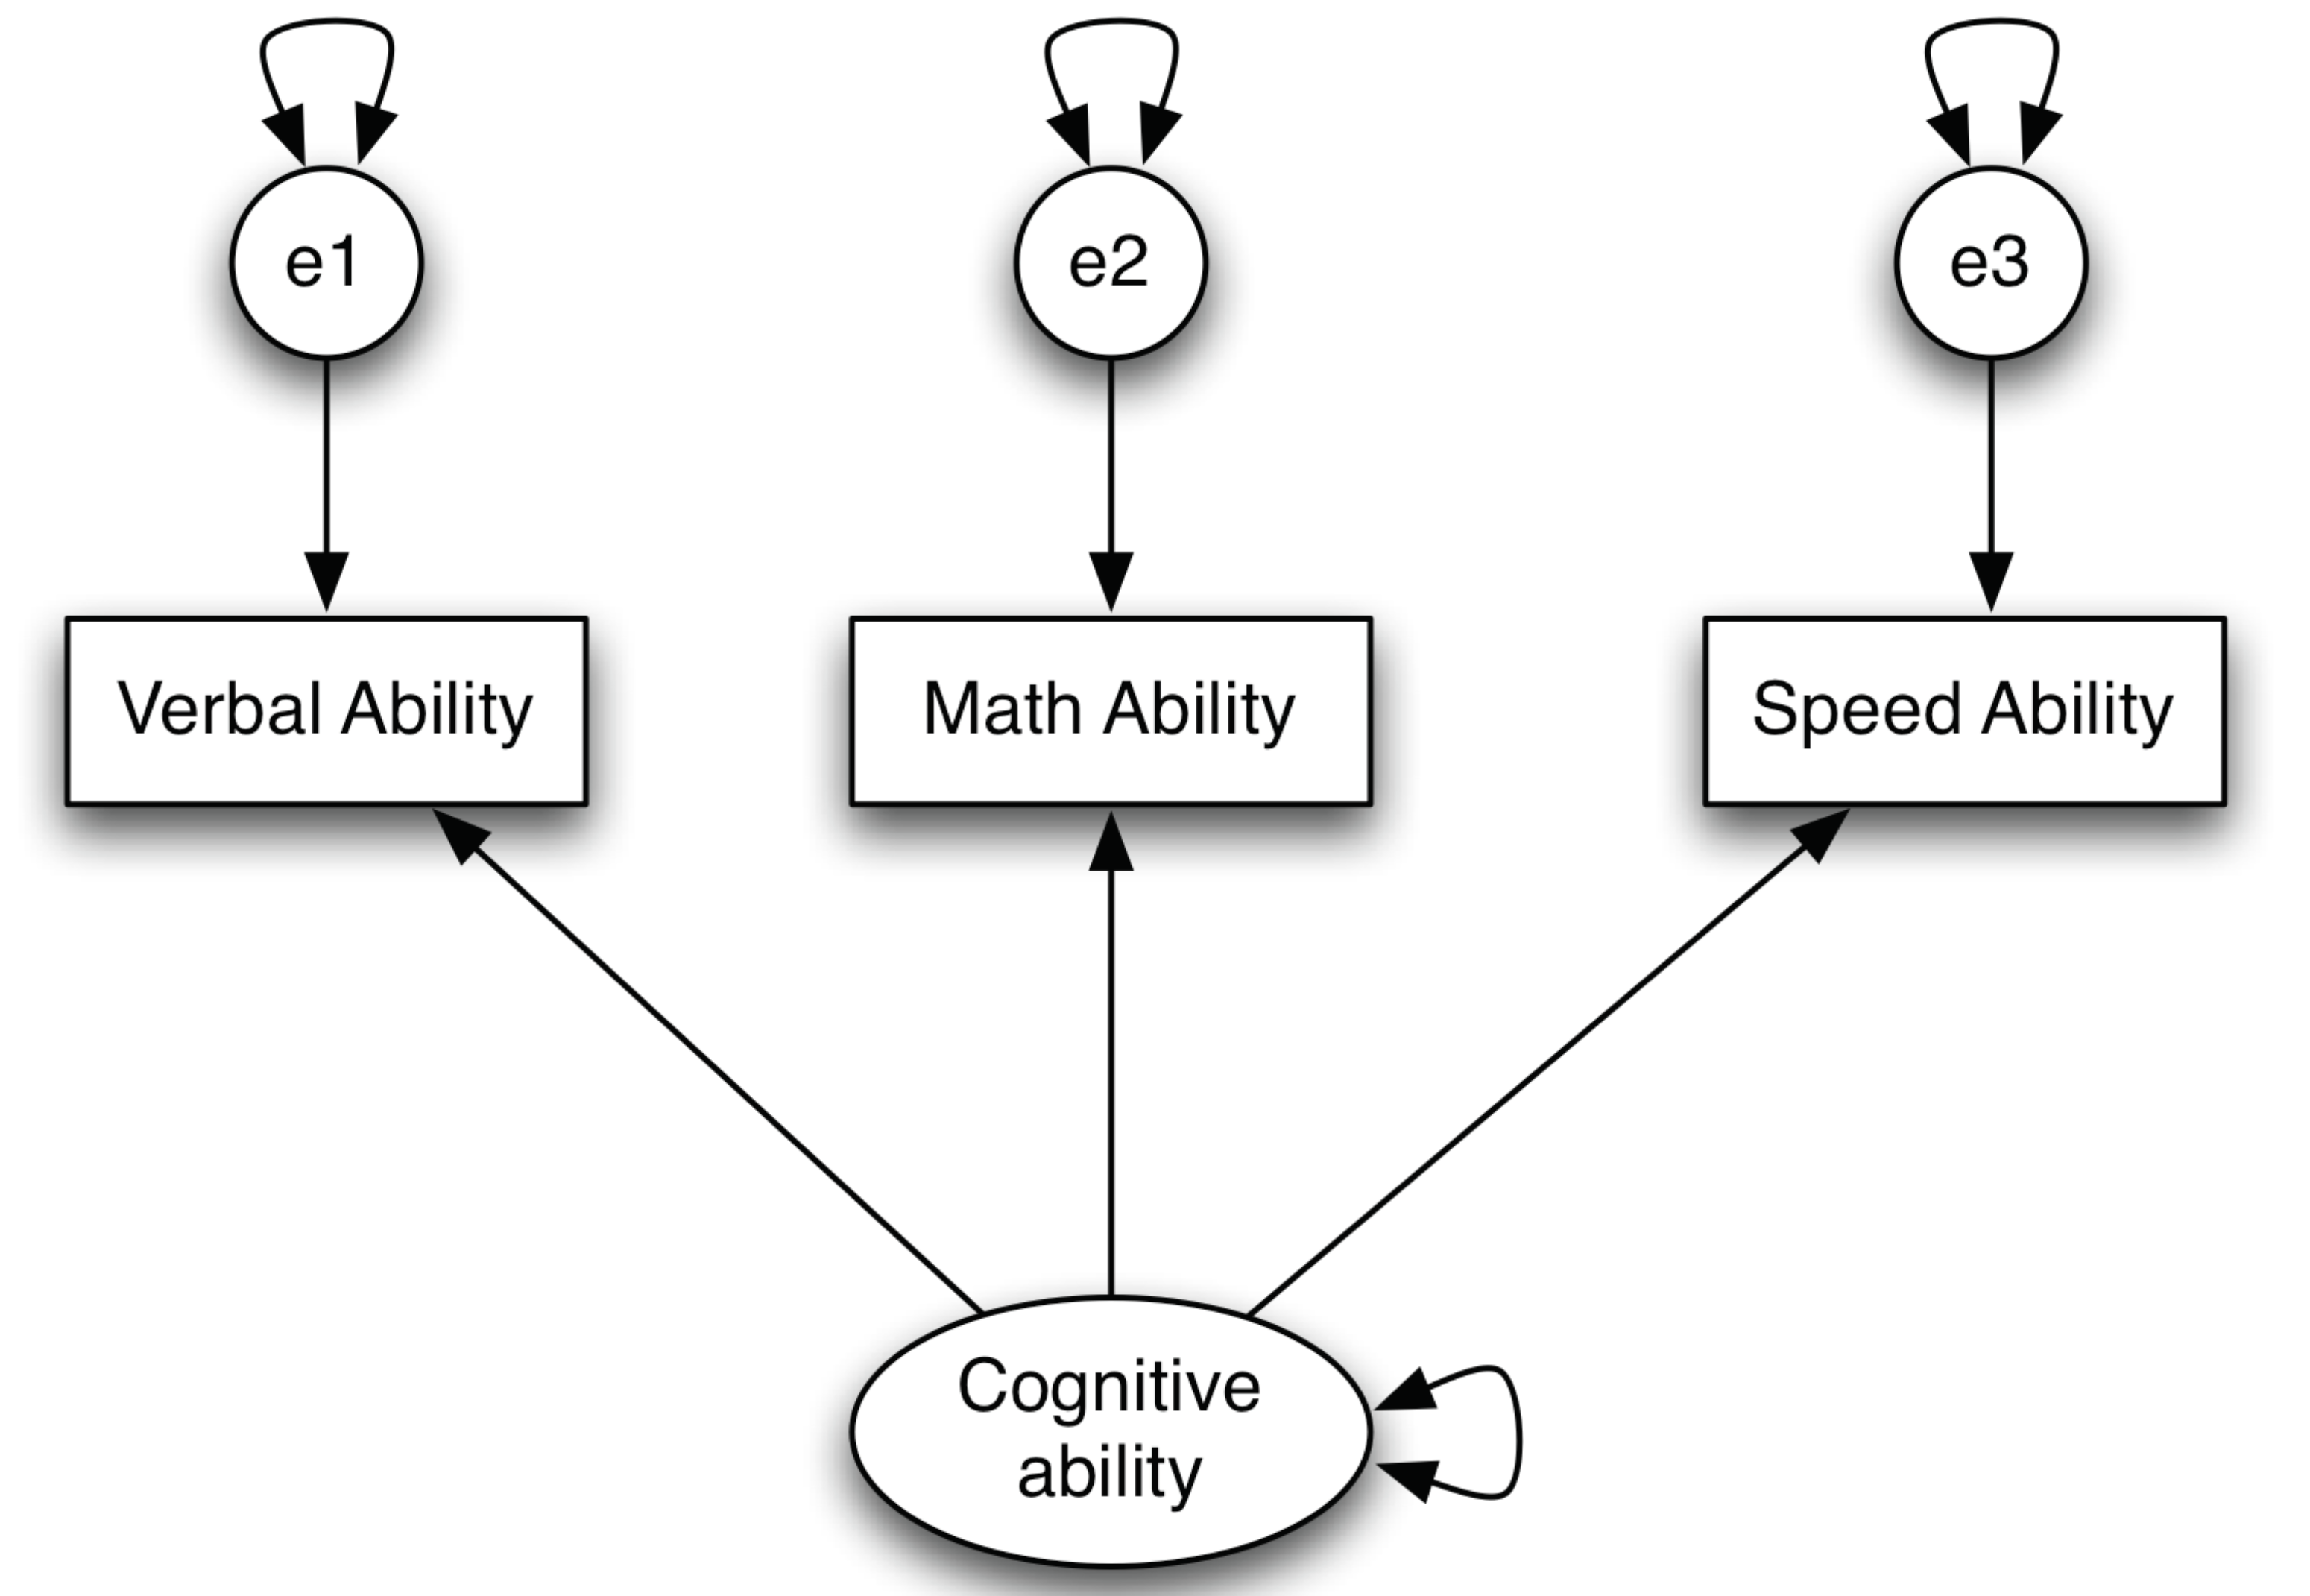
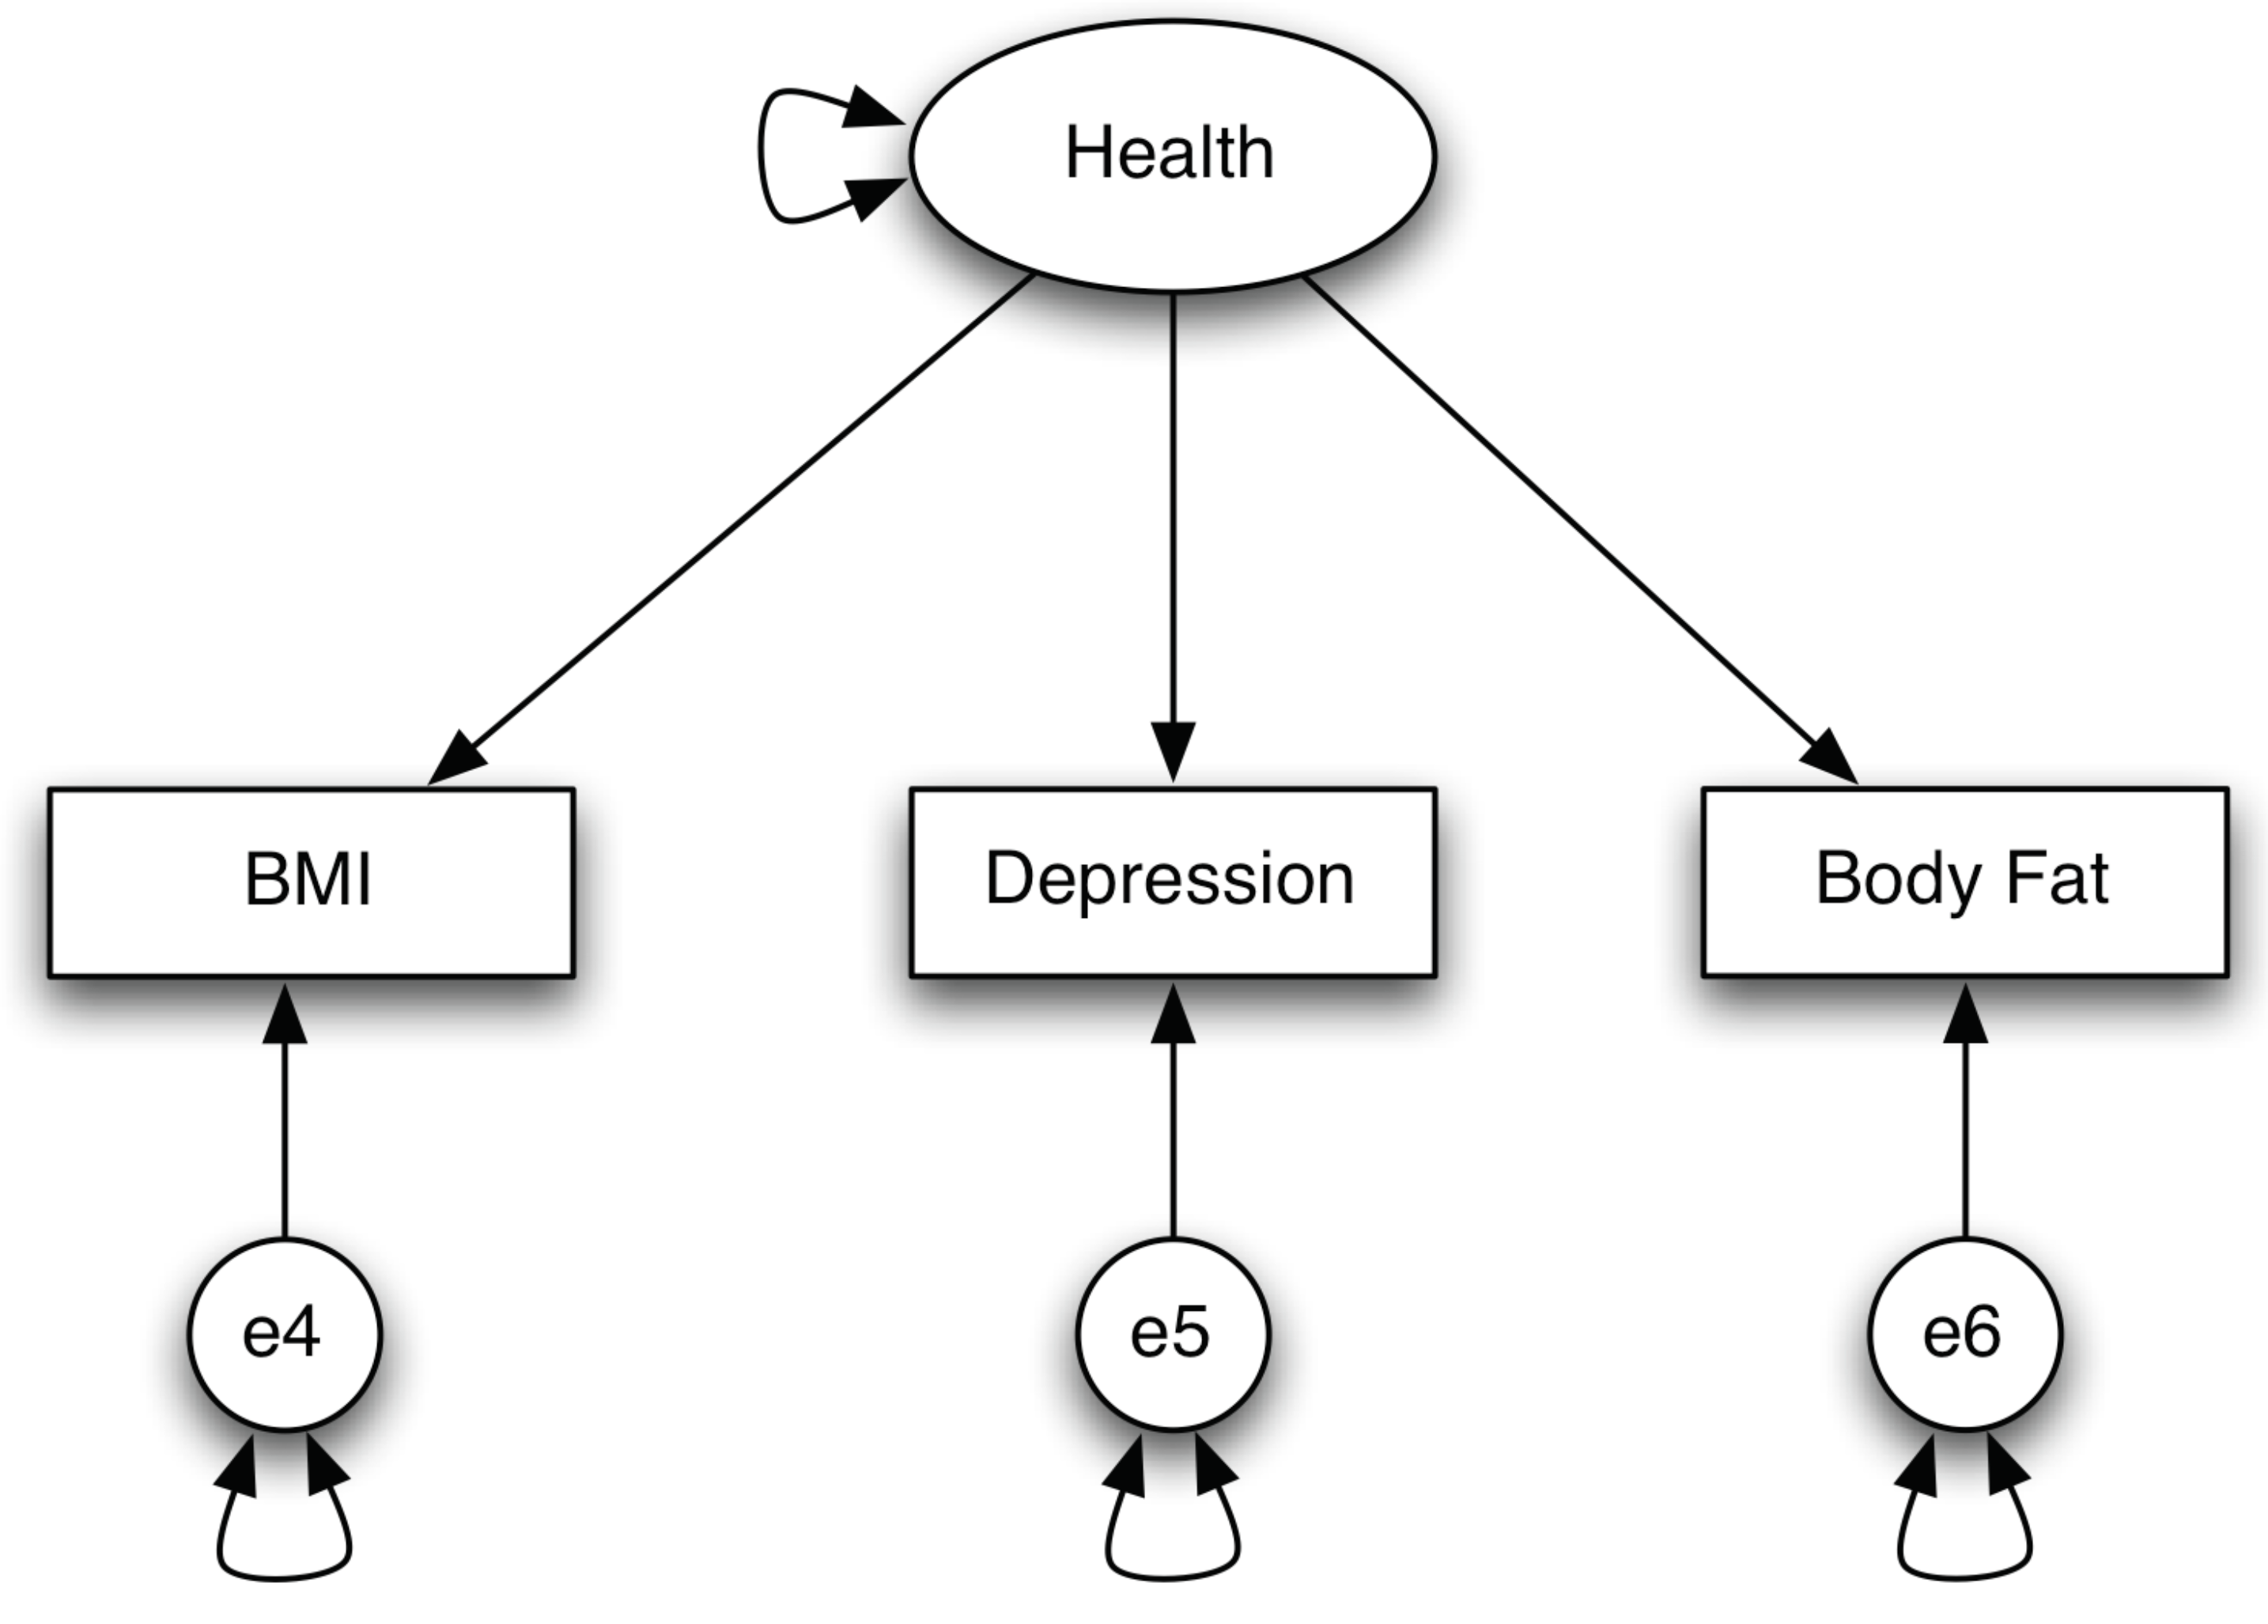
Figure 2 gives another example of measurement model – a model to measure health.
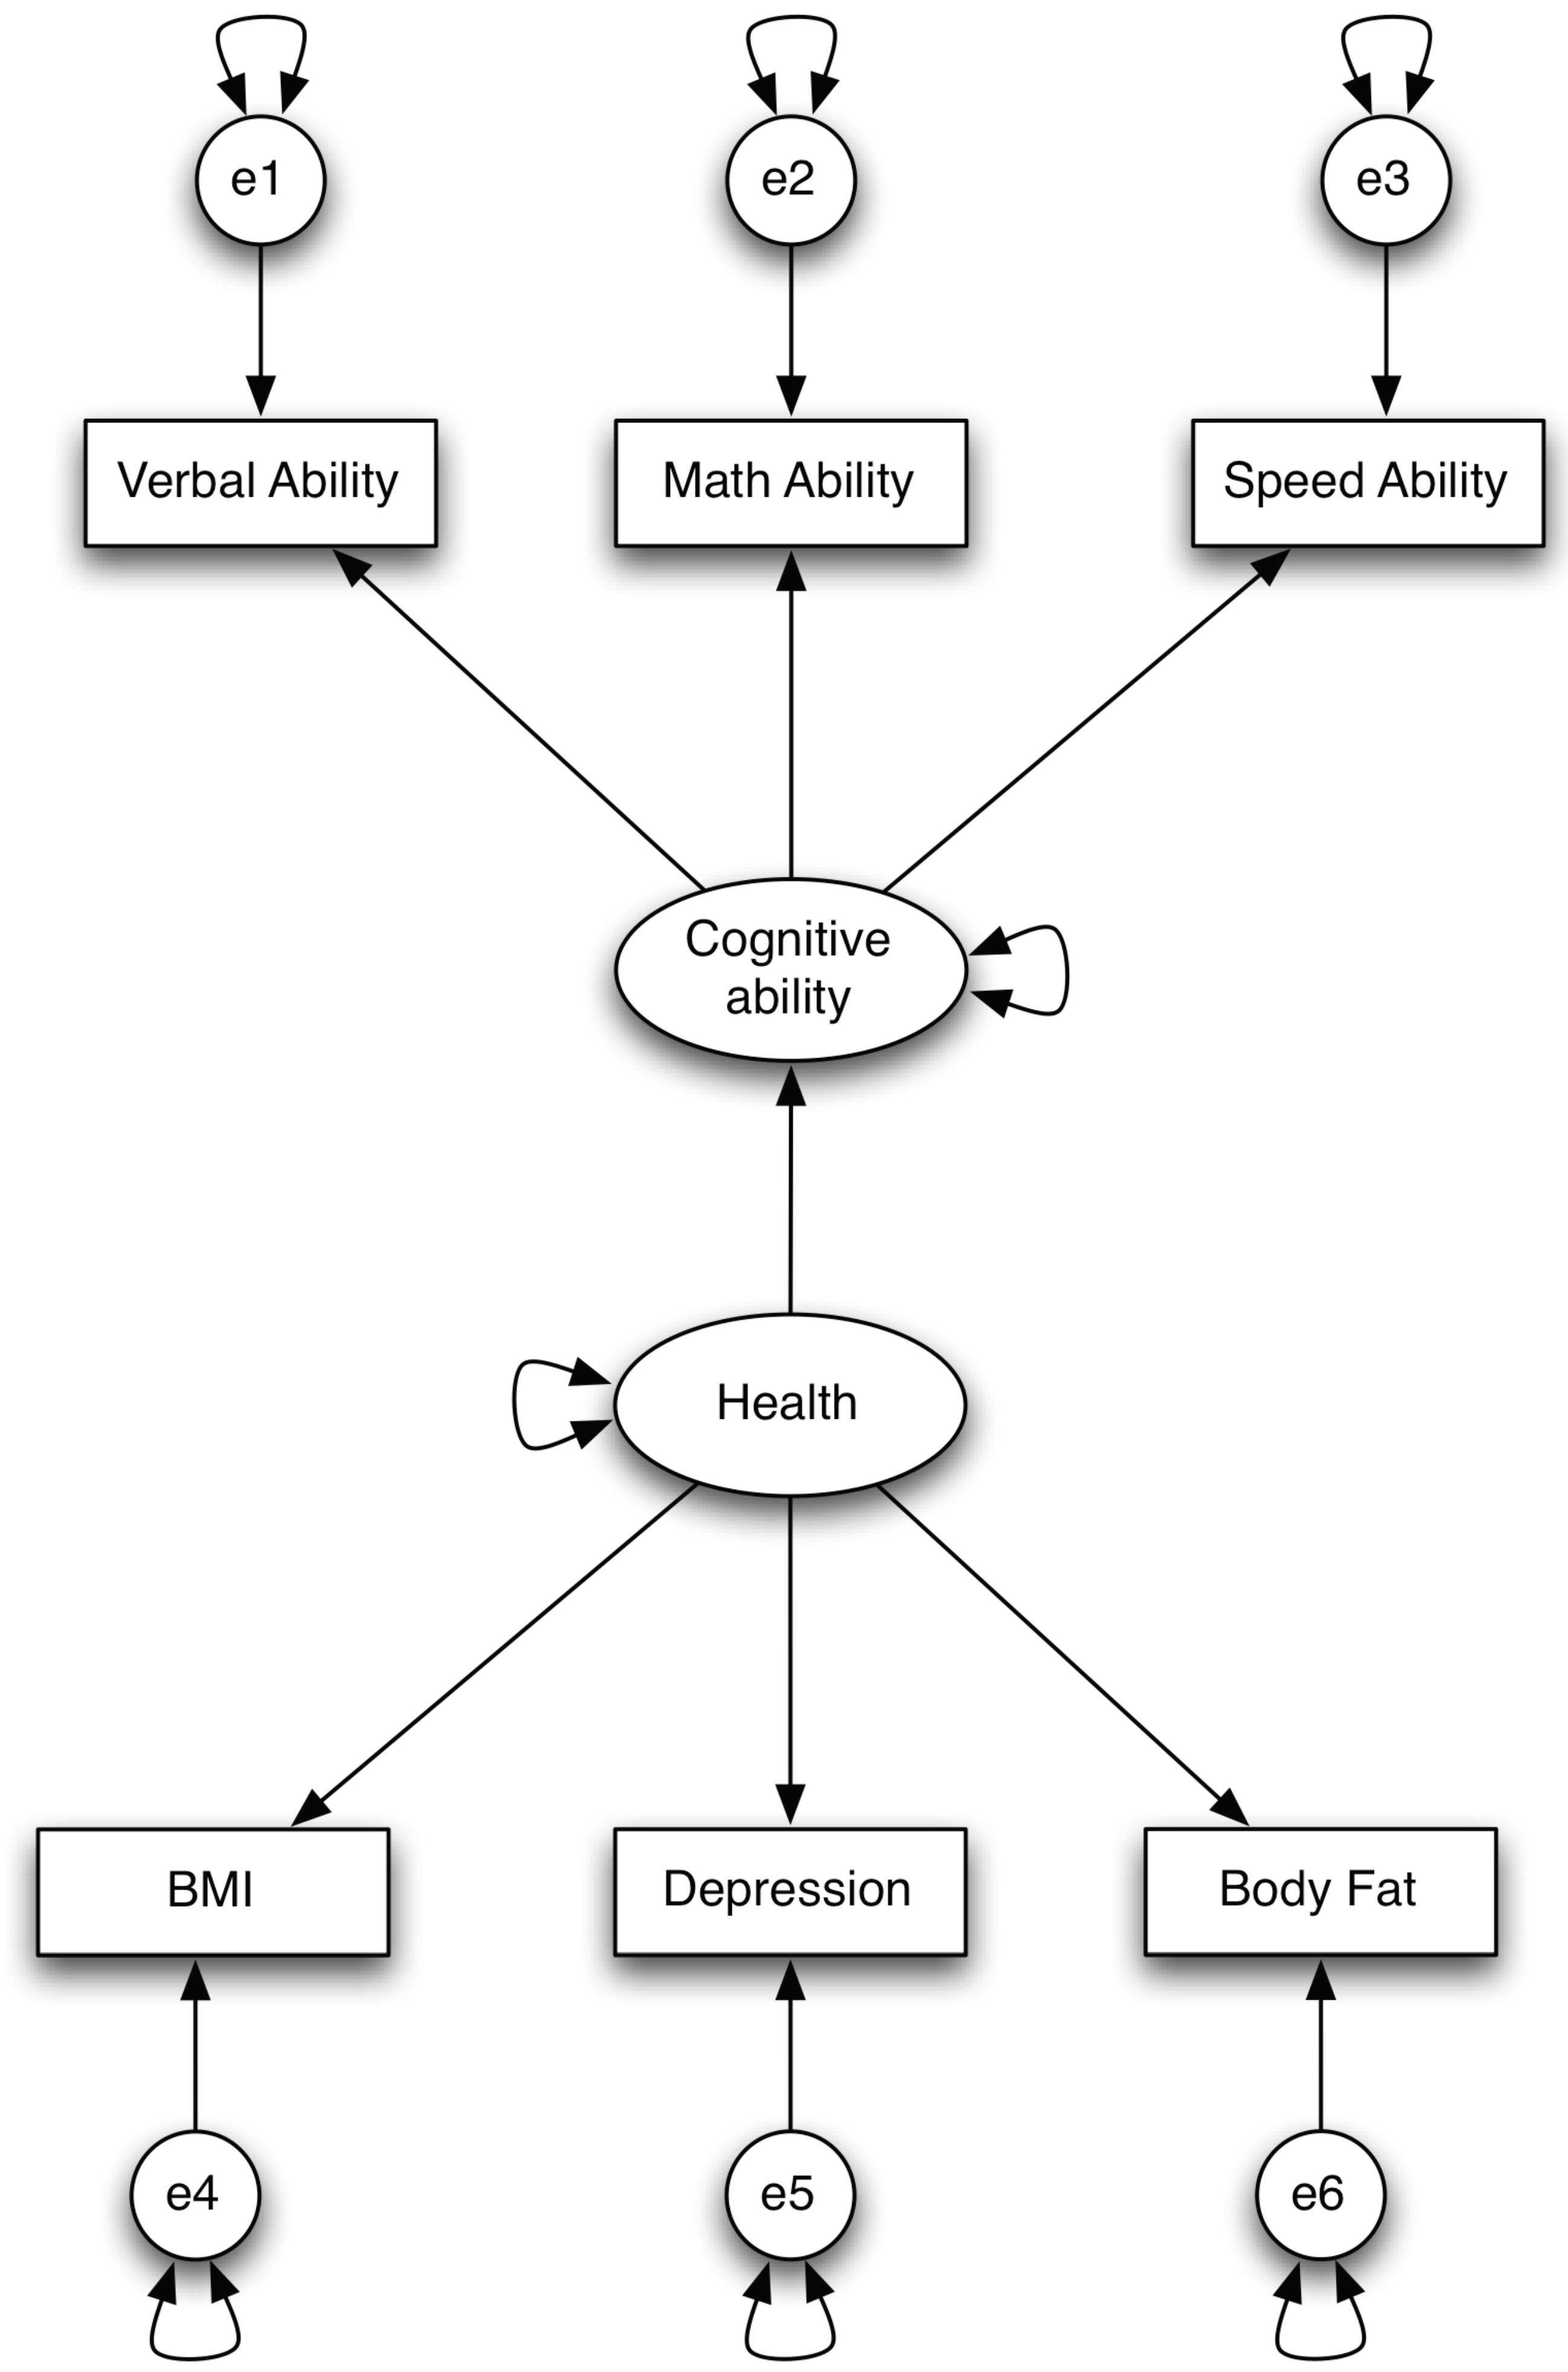
If one believes that health influences cognitive ability, then one can fit a path model using the factors – cognitive ability and health. Therefore, a structural model is actually a path model. Putting them together, we have a model in Figure 3. This model is called SEM model.
Example 1. Autoregressive model
In ACTIVE study, we have three variables – word series (ws), letter series (ls), and letter sets (ls) to measure reasoning ability. Also, we have data on all these three variables before and after training. Assume we want to test whether reasoning ability before training can predict reasoning ability after training. Then the SEM model in Figure 4 can be used. Not that we allow the factor in time 1 to predict the factor at time 2. In addition, we allow the uniqueness factors for each observed variable to be correlated. The R code for the analysis is given below.

First look at model fit. The chi-square value is 27 with 5 degrees of freedom. The p-value for chi-square test is almost 0. Thus, based on chi-square test, this is not a good model. However, CFI and TFI are both close to 1. The RMSEA is about 0.063 and SRMR is about 0.011. Considering the sample size here is large – N=1114, overall, we may accept this model is a fairly good model. Then we can answer our question. Because the regression coefficient from reasoning1 to reasoning2 is significant, reasoning ability before training seems to predict reasoning ability after training. In other words, those with higher reasoning ability before training tend to have higher reasoning ability after training.
>>> import pandas as pd
>>> import semopy as sem
>>>
>>> active = pd.read_csv('https://advstats.psychstat.org/data/active.full.csv')
>>> active.head()
   group  training  gender  age  edu  mmse  ...  ept5  hvltt6  ws6  ls6  lt6  ept6
0      3         1       2   67   13    27  ...    24      23    8   12    6    21
1      4         0       2   69   12    28  ...    22      28   17   16    7    17
2      1         1       2   77   13    26  ...    21      18   10   13    6    20
3      4         0       2   79   12    30  ...     9      21   12   14    6    11
4      4         0       2   78   13    27  ...    14      19    4    7    3    16

[5 rows x 36 columns]
>>>
>>> # Define the path model using the function Model
>>> reason = '''
...     reasoning1 =~ ws1 + ls1 + lt1
...     reasoning2 =~ ws2 + ls2 + lt2
...     reasoning2 ~ reasoning1
...     ws1 ~~ ws2
...     ls1 ~~ ls2
...     lt1 ~~ lt2
... '''
>>>
>>> # Create the SEM model
>>> model = sem.Model(reason)
>>>
>>> # Fit the model to data
>>> model.fit(active, obj='MLW')
SolverResult(fun=np.float64(0.024429719030555574), success=True, n_it=75, x=array([ 1.1923563 ,  0.42160725,  1.10989186,  0.41100013,  1.07255671,
        1.21544415,  5.50301535,  0.35631041,  4.54445574,  1.59682408,
        3.99730233,  5.16261326,  3.96313095, 19.09800275,  2.4438106 ,
        5.02860405]), message='Optimization terminated successfully', name_method='SLSQP', name_obj='MLW')
>>>
>>> # Get parameter estimates and model fit statistics
>>> params = model.inspect()
>>> print(params)
          lval  op        rval   Estimate  Std. Err    z-value   p-value
0   reasoning2   ~  reasoning1   1.072557  0.024421  43.919356       0.0
1          ws1   ~  reasoning1   1.000000         -          -         -
2          ls1   ~  reasoning1   1.192356  0.029734   40.10102       0.0
3          lt1   ~  reasoning1   0.421607  0.016032  26.298412       0.0
4          ws2   ~  reasoning2   1.000000         -          -         -
5          ls2   ~  reasoning2   1.109892  0.025606  43.344752       0.0
6          lt2   ~  reasoning2   0.411000  0.013963  29.435194       0.0
7   reasoning1  ~~  reasoning1  19.098003      1.06  18.016987       0.0
8   reasoning2  ~~  reasoning2   2.443811  0.288452   8.472166       0.0
9          ws1  ~~         ws2   1.215444  0.327033   3.716576  0.000202
10         ws1  ~~         ws1   5.503015  0.384439  14.314406       0.0
11         ls1  ~~         ls2   0.356310  0.401038   0.888471  0.374288
12         ls1  ~~         ls1   4.544456  0.474749   9.572341       0.0
13         lt1  ~~         lt2   1.596824  0.138309  11.545315       0.0
14         lt1  ~~         lt1   3.997302  0.181153  22.065868       0.0
15         ls2  ~~         ls2   5.162613   0.50702  10.182264       0.0
16         lt2  ~~         lt2   3.963131  0.181185  21.873453       0.0
17         ws2  ~~         ws2   5.028604  0.418802  12.007123       0.0
>>>
>>> # Check model fit
>>> fit_stats = sem.calc_stats(model)
>>> print(fit_stats.T)
                     Value
DoF               5.000000
DoF Baseline     15.000000
chi2             27.214707
chi2 p-value      0.000052
chi2 Baseline  5827.747609
CFI               0.996178
GFI               0.995330
AGFI              0.985990
NFI               0.995330
TLI               0.988535
RMSEA             0.063181
AIC              31.951141
BIC             112.202539
LogLik            0.024430
Example 2. Mediation analysis with latent variables
In path analysis, we have fitted a complex mediation model. Since we know that ws1, ls1, and lt1 are measurements of reasoning ability, we can form a latent reasoning ability variable. Thus, our mediation model can be expressed as in Figure 5.

Given CFI = 0.997, RMSEA = 0.034 and SRMR = 0.015, we accept the model as a good model even though the chi-square test is significant. Based on the Sobel test, the total indirect effect from age to ept1 through hvltt1 and reasoning is significant.
>>> import pandas as pd
>>> import semopy as sem
>>>
>>> active = pd.read_csv('https://advstats.psychstat.org/data/active.full.csv')
>>> active.head()
   group  training  gender  age  edu  mmse  ...  ept5  hvltt6  ws6  ls6  lt6  ept6
0      3         1       2   67   13    27  ...    24      23    8   12    6    21
1      4         0       2   69   12    28  ...    22      28   17   16    7    17
2      1         1       2   77   13    26  ...    21      18   10   13    6    20
3      4         0       2   79   12    30  ...     9      21   12   14    6    11
4      4         0       2   78   13    27  ...    14      19    4    7    3    16

[5 rows x 36 columns]
>>>
>>> # Define the path model using the function Model
>>> mediation = '''
... reasoning =~ ws1 + ls1 + lt1
... reasoning ~ p4*age + p8*edu
... hvltt1 ~ p2*age + p7*edu
... hvltt1 ~~ reasoning
... ept1 ~ p1*age + p6*edu + p3*hvltt1 + p5*reasoning
... '''
>>>
>>> # Create the SEM model
>>> model = sem.Model(mediation)
>>>
>>> # Fit the model to data
>>> model.fit(active, obj='MLW')
SolverResult(fun=np.float64(0.016486601279339652), success=True, n_it=61, x=array([ 1.1813286 ,  0.4302183 , -0.22776465,  0.74453542, -0.16096774,
        0.42906056,  0.03010017,  0.3958467 ,  0.16929646,  0.64380195,
        7.25417482, 20.62231162, 11.47651861,  4.84810153,  3.91702063,
       13.80250607,  5.33834949]), message='Optimization terminated successfully', name_method='SLSQP', name_obj='MLW')
>>>
>>> # Get parameter estimates and model fit statistics
>>> params = model.inspect()
>>> print(params)
         lval  op       rval   Estimate  Std. Err    z-value   p-value
0   reasoning   ~        age  -0.227765  0.023387  -9.738998       0.0
1   reasoning   ~        edu   0.744535  0.047138  15.794814       0.0
2      hvltt1   ~        age  -0.160968  0.026505  -6.073008       0.0
3      hvltt1   ~        edu   0.429061  0.052478   8.176057       0.0
4         ws1   ~  reasoning   1.000000         -          -         -
5         ls1   ~  reasoning   1.181329  0.028638  41.250755       0.0
6         lt1   ~  reasoning   0.430218  0.016082  26.752113       0.0
7        ept1   ~        age   0.030100  0.021597    1.39371  0.163405
8        ept1   ~        edu   0.395847  0.046402   8.530857       0.0
9        ept1   ~     hvltt1   0.169296  0.026082    6.49092       0.0
10       ept1   ~  reasoning   0.643802   0.03536  18.206843       0.0
11     hvltt1  ~~  reasoning   7.254175  0.591505  12.263938       0.0
12     hvltt1  ~~     hvltt1  20.622312  0.873795  23.600847       0.0
13  reasoning  ~~  reasoning  13.802506  0.776626  17.772392       0.0
14       ept1  ~~       ept1  11.476519  0.521154  22.021337       0.0
15        ls1  ~~        ls1   4.848102  0.444375  10.909932       0.0
16        lt1  ~~        lt1   3.917021  0.180868  21.656765       0.0
17        ws1  ~~        ws1   5.338349  0.365475  14.606612       0.0
>>>
>>> # Check model fit
>>> fit_stats = sem.calc_stats(model)
>>> print(fit_stats.T)
                     Value
DoF              11.000000
DoF Baseline     23.000000
chi2             18.366074
chi2 p-value      0.073466
chi2 Baseline  3349.940000
CFI               0.997786
GFI               0.994517
AGFI              0.988537
NFI               0.994517
TLI               0.995371
RMSEA             0.024529
AIC              33.967027
BIC             119.234138
LogLik            0.016487
To cite the book, use:
Zhang, Z. & Wang, L. (2017-2026). Advanced statistics using R. Granger, IN: ISDSA Press. https://doi.org/10.35566/advstats. ISBN: 978-1-946728-01-2.
To take the full advantage of the book such as running analysis within your web browser, please subscribe.